The Central Bureau of Statistics (CBS) informs the results of the Censo2020. The results of Censo2020 are compared with Censo2010 to indicate if there were changes over the last 10 years. The results are categorized into eight topics. Here are the results for the topic, Population
How many are we?
During the Censo2020 a total of 108.166 persons were counted, representing an increase of 6.682 persons compared to Censo2010. It means that in the last ten years, our population continued to grow more slowly than in the prior decades. During the last ten years, the population increased by 6.6%. It means that the population density continues to grow. While in the Censo2010 there were 564 persons per square kilometer, during the Censo2021 they counted 601 persons per square kilometers. Our population consists of more women than men. Women represent 52.8% and men 47.2% of the population. The average median age is 42 years. It entails four years more compared to Censo2010. The average age of women is 43 years and of men 40 years. The largest group of our population consists of adults between 18 to 64 years old. They represent 62.8% of the population. Compared to Censo2010 this group increased by 4.3%. The second largest group consists of children and youth between 0 and 17 years. They represent 21.2% of our population. Compared to Census2010 this group decreased by 10.9%. The smallest group of our population consists of senior citizens, persons 65 years and older. This group consists of 16.0% of the population. Compared with Censo2010, it increased by 63%. In other words, the population of Aruba increasingly consists of persons 65 years and older.
Housing
According to the data collected by Censo2020, 78.3% of households in Aruba live in a house. In Censo2010, 79.5% of households lived in houses. The second-largest group of households lives in an apartment. This group represents 17.9% of households in Aruba. It entails a slight increase compared to Censo 2010, where 16.4% of households lived in apartments
3.8% of the total households live in different types of housing, namely:
- 2.0% live in trailer or container;
- 1.2% live in a separate room within a house;
- 0.4% live in an outside room;
- 0.2% live in other types of housing, for example, a condominium.
Compared to prior censuses, for example, 2000 and 2010, there are no significant changes in the percentage of households living in these types of housing, except for households living in an outside room.
In the Censo2000, 2.0% of households in Aruba lived in an outside room. The percentage dropped to 1.1% in Censo 2010 and continued to decline to 0.4% in Censo2020.
Homeownership
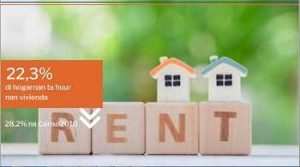
The Censo2020 results indicate that 75% of households own the house they live in. It represents an increase of 11.9% compared to Censo2010, where the percentage stood at 67%. The percentage of households that rent their home decreased from 28.2% in Censo2010 to 22.3% in Censo2020. The percentage of households that live free of charge in their homes also decreased from 3.7% in 2010 to 2.4% in 2020.
For more information, you may visit the CBS website www.census2020.aw or their Facebook: Central Bureau of Statistics Aruba.


